
Page 104 - 《橡塑技术与装备》英文版2026年2期
P. 104
HINA R&P TECHNOLOGY AND EQUIPMENT
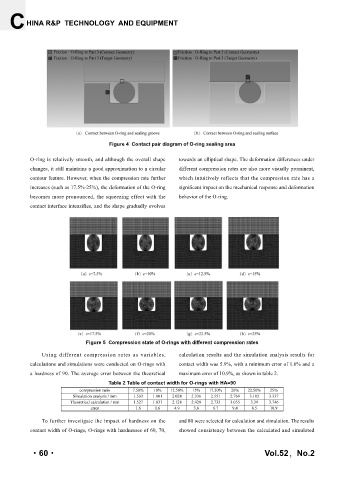
Figure 4 Contact pair diagram of O-ring sealing area
O-ring is relatively smooth, and although the overall shape towards an elliptical shape. The deformation differences under
changes, it still maintains a good approximation to a circular different compression rates are also more visually prominent,
contour feature. However, when the compression rate further which intuitively reflects that the compression rate has a
increases (such as 17.5%-25%), the deformation of the O-ring significant impact on the mechanical response and deformation
becomes more pronounced, the squeezing effect with the behavior of the O-ring.
contact interface intensifies, and the shape gradually evolves
Figure 5 Compression state of O-rings with different compression rates
Using different compression rates as variables, calculation results and the simulation analysis results for
calculations and simulations were conducted on O-rings with contact width was 5.9%, with a minimum error of 1.6% and a
a hardness of 90. The average error between the theoretical maximum error of 10.9%, as shown in table 2.
Table 2 Table of contact width for O-rings with HA=90
compression ratio 7.50% 10% 12.50% 15% 17.50% 20% 22.50% 25%
Simulation analysis / mm 1.503 1.801 2.024 2.336 2.551 2.769 3.102 3.337
Theoretical calculation / mm 1.527 1.831 2.128 2.428 2.735 3.055 3.39 3.746
error 1.6 1.6 4.9 3.8 6.7 9.4 8.5 10.9
To further investigate the impact of hardness on the and 80 were selected for calculation and simulation. The results
contact width of O-rings, O-rings with hardnesses of 60, 70, showed consistency between the calculated and simulated
·60· Vol.52,No.2