
Page 105 - 《橡塑技术与装备》英文版2026年2期
P. 105
PRODUCT AND DESIGN
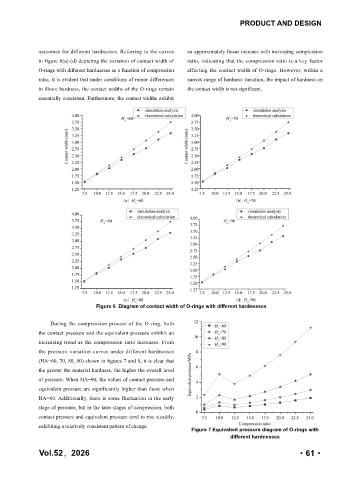
outcomes for different hardnesses. Referring to the curves an approximately linear increase with increasing compression
in figure 6(a)-(d) depicting the variation of contact width of ratio, indicating that the compression ratio is a key factor
O-rings with different hardnesses as a function of compression affecting the contact width of O-rings. However, within a
ratio, it is evident that under conditions of minor differences narrow range of hardness variation, the impact of hardness on
in Shore hardness, the contact widths of the O-rings remain the contact width is not significant.
essentially consistent. Furthermore, the contact widths exhibit
Figure 6 Diagram of contact width of O-rings with different hardnesses
During the compression process of the O-ring, both
the contact pressure and the equivalent pressure exhibit an
increasing trend as the compression ratio increases. From
the pressure variation curves under different hardnesses
(HA=60, 70, 80, 90) shown in figures 7 and 8, it is clear that
the greater the material hardness, the higher the overall level
of pressure. When HA=90, the values of contact pressure and
equivalent pressure are significantly higher than those when
HA=60. Additionally, there is some fluctuation in the early
stage of pressure, but in the later stages of compression, both
contact pressure and equivalent pressure tend to rise steadily,
exhibiting a relatively consistent pattern of change.
Figure 7 Equivalent pressure diagram of O-rings with
different hardnesses
Vol.52,2026 ·61·