
Page 57 - 《橡塑技术与装备》英文版2026年2期
P. 57
THEORY AND RESEARCH
8%PPO is calculated as M 2 =6998, and the average molecular Using the Origin plotting tool, the data obtained from the
weight M 3 of the BPO reaction product of PPO-5%PPO is DSC tester was plotted to generate the following DSC curves.
calculated as M 3 =12,067. Figure 3 shows the DSC curves of three samples at heating
3.3 Study on curing kinetics rates of 5 ℃ /min, 10 ℃ /min, 15 ℃ /min, and 20 ℃ /min.
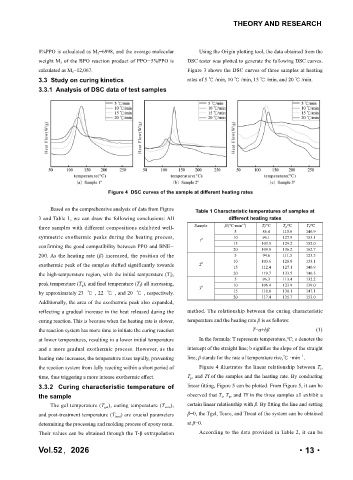
3.3.1 Analysis of DSC data of test samples
Figure 4 DSC curves of the sample at different heating rates
Based on the comprehensive analysis of data from Figure Table 1 Characteristic temperatures of samples at
3 and Table 1, we can draw the following conclusions: All different heating rates
-1
three samples with different compositions exhibited well- Sample β/(℃·min ) T i /℃ T p /℃ T f /℃
5 86.4 115.6 146.9
symmetric exothermic peaks during the heating process, 10 96.1 127.9 153.1
1 #
confirming the good compatibility between PPO and BNE- 15 103.5 129.2 152.0
20 109.8 136.2 162.7
200. As the heating rate (β) increased, the position of the 5 94.6 111.5 123.5
10 103.6 120.8 133.1
#
exothermic peak of the samples shifted significantly towards 2 15 112.4 127.1 140.9
the high-temperature region, with the initial temperature (T i ), 20 119.7 133.5 146.3
5 96.3 113.4 132.2
peak temperature (T p ), and final temperature (T f ) all increasing, 10 106.4 123.9 139.0
3 #
by approximately 23 ℃ , 22 ℃ , and 20 ℃ , respectively. 15 110.8 130.1 147.1
20 117.4 135.7 153.0
Additionally, the area of the exothermic peak also expanded,
reflecting a gradual increase in the heat released during the method. The relationship between the curing characteristic
curing reaction. This is because when the heating rate is slower, temperature and the heating rate β is as follows:
the reaction system has more time to initiate the curing reaction T=a+bβ (1)
at lower temperatures, resulting in a lower initial temperature In the formula: T represents temperature,℃; a denotes the
and a more gradual exothermic process. However, as the intercept of the straight line; b signifies the slope of the straight
-1
heating rate increases, the temperature rises rapidly, preventing line; β stands for the rate of temperature rise,℃ ·min .
the reaction system from fully reacting within a short period of Figure 4 illustrates the linear relationship between T i ,
time, thus triggering a more intense exothermic effect. T p , and Tf of the samples and the heating rate. By conducting
3.3.2 Curing characteristic temperature of linear fitting, Figure 5 can be plotted. From Figure 5, it can be
the sample observed that T i , T p , and Tf in the three samples all exhibit a
The gel temperature (T gel ), curing temperature (T cure ), certain linear relationship with β. By fitting the line and setting
and post-treatment temperature (T treat ) are crucial parameters β=0, the Tgel, Tcure, and Ttreat of the system can be obtained
determining the processing and molding process of epoxy resin. at β=0.
Their values can be obtained through the T-β extrapolation According to the data provided in Table 2, it can be
Vol.52,2026 ·13·