
Page 77 - 《橡塑技术与装备》英文版2026年2期
P. 77
MATERIALS AND FORMULATIONS
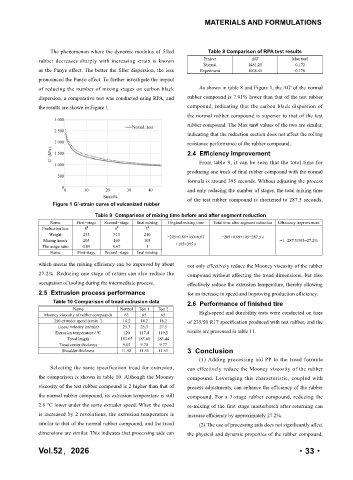
The phenomenon where the dynamic modulus of filled Table 8 Comparison of RPA test results
rubber decreases sharply with increasing strain is known Project ΔG' Max tanθ
Normal 1481.21 0.172
as the Panye effect. The better the filler dispersion, the less Experiment 1608.41 0.170
pronounced the Panye effect. To further investigate the impact
of reducing the number of mixing stages on carbon black As shown in table 8 and Figure 1, the ΔG' of the normal
dispersion, a comparative test was conducted using RPA, and rubber compound is 7.91% lower than that of the test rubber
the results are shown in Figure 1. compound, indicating that the carbon black dispersion of
the normal rubber compound is superior to that of the test
rubber compound. The Max tanθ values of the two are similar,
indicating that the reduction section does not affect the rolling
resistance performance of the rubber compound.
2.4 Efficiency improvement
From table 9, it can be seen that the total time for
producing one truck of final rubber compound with the normal
formula is around 395 seconds. Without adjusting the process
and only reducing the number of stages, the total mixing time
of the test rubber compound is shortened to 287.5 seconds,
Figure 1 G'-strain curve of vulcanized rubber
Table 9 Comparison of mixing time before and after segment reduction
Name First-stage Second-stage final mixing Original mixing time Total time after segment reduction Efficiency improvement
Production line 8 # 6 # 3 #
Weight 235 315 210 =205×0.89+160×0.67 =205×0.89+105=287.5 s
Mixing time/s 205 160 105 =1-287.5/395=27.2%
The usage ratio 0.89 0.67 1 +105=395 s
Name First-stage Second -stage final mixing
which means the mixing efficiency can be improved by about not only effectively reduce the Mooney viscosity of the rubber
27.2%. Reducing one stage of return can also reduce the compound without affecting the tread dimensions, but also
occupation of tooling during the intermediate process. effectively reduce the extrusion temperature, thereby allowing
2.5 Extrusion process performance for an increase in speed and improving production efficiency.
Table 10 Comparison of tread extrusion data 2.6 Performance of finished tire
Name Normal Test 1 Test 2
Mooney viscosity of rubber compounds 63 65 65 High-speed and durability tests were conducted on tires
-1
250 extruder speed (r.min ) 14.2 14.2 16.2 of 235/50 R17 specification produced with test rubber, and the
Linear velocity (m/min) 25.3 25.3 27.5
Extrusion temperature / ℃ 120 117.4 119.5 results are presented in table 11.
Tread length 183.65 183.60 183.44
Tread center thickness 9.65 9.70 9.77
Shoulder thickness 11.58 11.55 11.63 3 Conclusion
(1) Adding processing aid PP to the tread formula
Selecting the same specification tread for extrusion, can effectively reduce the Mooney viscosity of the rubber
the comparison is shown in table 10. Although the Mooney compound. Leveraging this characteristic, coupled with
viscosity of the test rubber compound is 2 higher than that of process adjustments, can enhance the efficiency of the rubber
the normal rubber compound, its extrusion temperature is still compound. For a 3-stage rubber compound, reducing the
2.6 ℃ lower under the same extruder speed. When the speed re-mixing of the first stage masterbatch after returning can
is increased by 2 revolutions, the extrusion temperature is increase efficiency by approximately 27.2%.
similar to that of the normal rubber compound, and the tread (2) The use of processing aids does not significantly affect
dimensions are similar. This indicates that processing aids can the physical and dynamic properties of the rubber compound,
Vol.52,2026 ·33·